Cybersecurity professionals use a variety of tools. Intrusion Detection Systems (IDS) and Intrusion Prevention Systems (IPS) sit on the edge and prevent threats from getting into your network. Endpoint Detection and Response (EDR) tools have come a long way from the anti-virus applications of old. Cloud technologies have boomed over the past few years, and they come with their own suite of cloud security tools. The common thread between most tools is their signature-based and reactive approach.
There is a newer tool in the tool belt of security that is growing in prevalence and necessity. That tool is what is known as ‘threat hunting.’
What Is Threat Hunting?
Threat hunting is the proactive process of searching for malicious activity within an organization’s IT infrastructure. When executed correctly, threat hunting can augment signature-based detections and provide insights for further investigation. It can be utilized to fill security control gaps within the organization and to provide a feedback loop to improve existing controls.
The following is an overview of threat hunting, including a definition of what threat hunting is and how it’s performed. Then, read on for a high-level walk-through of a threat hunt from hypothesis to execution.
If you’re unfamiliar with threat hunting and the process of developing and executing a hunt then you’re in the right place. If you’re familiar with the topic but constantly quest for knowledge then you’re still in the right place. If you’re not sure how you got here, read on and you might learn something new.
How Is Threat Hunting Performed?
Threat hunting is the process of testing a hypothesis against data and analyzing the results. A hypothesis is a supposition or proposed explanation made on the basis of limited evidence, and this proposed explanation is then used as a starting point for further investigation.
Threat hunting includes creating a hypothesis, researching, and executing hunts for various types of hypotheses. Types of hypotheses will vary based on the text that’s been read. For the purposes of this article and it’s follow-up post, the focus will be on TTP (Tactics, Techniques, and Procedures), Intelligence or IOC (indicators of compromise), and Analytics-based hypotheses.
First, let’s cover the high-level steps involved in a threat hunt, and then apply those same steps to a TTP-based hunt example.
The Threat Hunting Hypothesis
A threat hunt hypothesis, much like a scientific hypothesis, is a statement of an idea or explanation to test against data. A hypothesis can take many forms depending on the methods chosen. It could be as pointed as identifying a process execution within Windows event logs or searching for IOCs for a new zero-day vulnerability. It could also be statistics based such as searching for data exfiltration by analyzing outbound traffic volume.
The hunt hypothesis can be generated from a number of sources. These include but are not limited to new zero-day vulnerabilities, threat actor research, threat intelligence, security control gaps, incident reports, and many more sources. Regardless of the source, the foundations of a good hypothesis are relevance and testability.
Relevance – How does the hypothesis relate to organizational needs, current industry trends, and available data sources?
Testability – The data and tools you have available to you must provide some chance of finding what you are looking for within your hypothesis.
Threat Hunting Research
Once the hypothesis has been established, it’s time to research. Researching allows the threat hunter to focus their efforts and gain a better understanding of the actions they are trying to uncover. It also allows time to confirm the data that is needed to execute the hunt is in Splunk. Research can come from a number of sources such as other party’s research papers, Digital Forensics and Incident Response (DFIR) reports, or attack ranges such as Splunk’s Attack Range or DetectionLab.
Vendor documentation is an invaluable source for research. Understanding how a device, process, or tool functions is vital to understanding what is normal versus abnormal and establishing testing methods. Knowing what arguments an executable accepts and what those arguments actually do can make the search more pointed. Understanding relationships between processes or network traffic can help eliminate uncertainty when reviewing results.
In the case of TTP hunting, it’s about studying the actions of an adversary – learning their tools and techniques, how they are used, and how best to detect them. Intelligence hunting is more than completeness of the data; the goal is to fully identify and gather the IOCs needed to execute a thorough search. Analytics-based hunting is more about statistical analysis and understanding why the increase/decrease in a metric could indicate malicious intent.
Threat Hunt Search Development
Developing the threat hunt’s Search Processing Language (SPL) is a combination of knowing where the data is located, what’s being hunted, and understanding the language. The two former are obtained through the research phase. The latter is obtained through experience and training. Knowledge of the Splunk commands that allow data manipulation is vital. The depth of knowledge needed, however, varies based on the hunt method.
Splunk has great documentation on SPL on their site. Splunk’s .conf conference is also a good resource for talks and information related to the many uses of Splunk. See the references section below to learn more about Splunk threat hunting.
When hunting TTPs, the search process may be straightforward and involve searching for key indicators across a series of fields or event types. Intelligence-based hunting, or IOC, is about speed and might rely more on using tstats commands. tstats is a Splunk command that’s used for searching against accelerated data models and indexed fields. If you’re not familiar with tstats or data models, there’s a link to a Splunk .conf talk in the resources section below. Finally, analytics hunts might require in-depth knowledge of stats, eventstats, or streamstats commands – all of which are powerful Splunk commands for looking at how events are tied together.
The SPL development process can be a trial-and-error process, especially as the complexity of the hunt increases.
Threat Hunt Execution
The execution phase is the culmination of all the previous steps. We’ve defined what we’re hunting, researched how to identify it in the logs, identified that we have the data we need, and developed the search by writing the SPL. The next step is to apply all these to the data to either prove or disprove the hypothesis.
During this phase, the SPL will likely need some further modifications. These modifications may include building exclusion lists based on false positives when the data is returned, and/or establishing or modifying thresholds based on statistical output.
Once complete, the results are analyzed and any findings deemed suspicious or malicious can be further investigated by security personnel within the organization.
A Splunk TTP Threat Hunting Example
Now with the high-level steps involved in a hunt covered, let’s jump in to applying those same steps to a TTP-based hunt.
Step 1. Hypothesis and Research
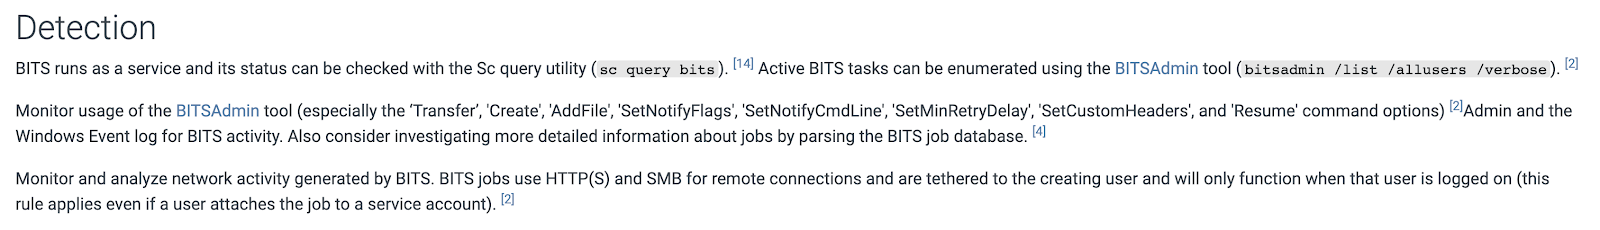
TTP-based threat hunting involves taking a known tactic, technique, or procedure and utilizing it as the hypothesis for the threat hunt. In this example, we’re going to use MITRE ATT&CK technique T1197 BITS Job as the starting point. The system component BITS (Background Intelligent Transfer Service) can be used to download files onto a compromised system. For the threat hunt hypothesis, we’ll utilize the adversarial action.
Hypothesis: A threat actor can use bitasdmin.exe to download a file to an endpoint on the organization’s network.
The MITRE page provides some detection information for a given technique, but first let’s gather some more information to ensure we fully understand the hunt.
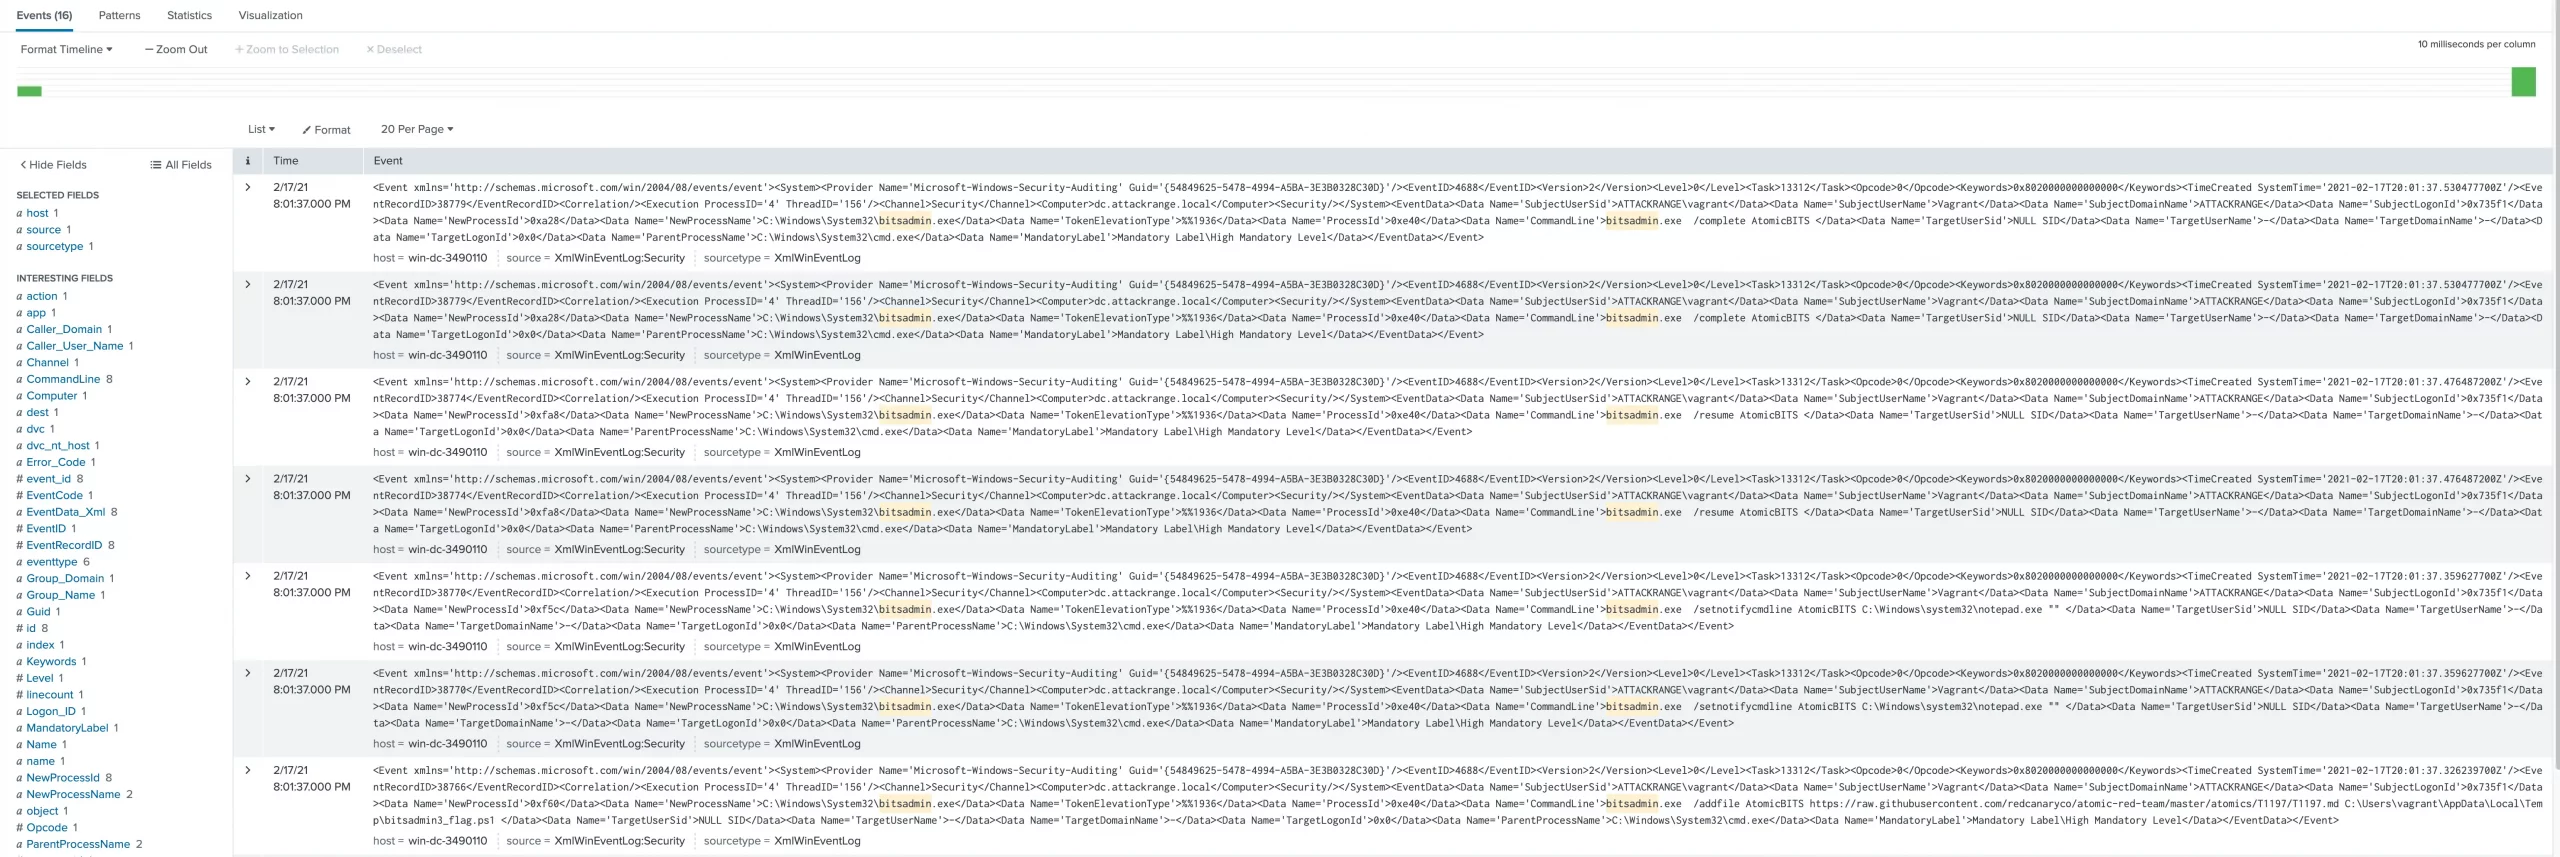
‘wineventlog’ index search results on Event ID 4688 events with bitsadmin.exe
Step 2. Development and Execution
The data we’ll be investigating is an Atomic Red Team test within Splunk’s Attack Range; more information on these can be found in the reference links at the bottom of the article. It is also worth noting that the data we’ll be examining contains command-line arguments. As discussed in my recent article on Windows Event ID 4688, this option is not on by default within Windows. However, it can be enabled fairly easily via GPO (Group Policy Object).
Based on the research performed and what we know about the data, let’s establish some information to make creating the search easier. The Windows event log sample data is being stored in the ‘wineventlog’ index. Notice the Event ID 4688 events available to us with command-line arguments. The first search is going to check the New_Process_Name field of the Event ID 4688 events for the presence of bitsadmin.exe
Refined ‘wineventlog’ index search results with XML table
The result is 16 events that match search criteria, but we need to determine if it matches the hunt criteria. This is where the command-line arguments found in the earlier research gets added. One option is to keep the previous search as-is, and add “Process_Command_Line IN (*create*,*addfile*,*addfileset*)” to it. Using the IN operator within a Splunk search provides a shorthand way of saying X=A OR X=B OR X=C. Instead, a comma-separated list is used so the search becomes X IN (A,B,C).
index=wineventlog EventCode=4688 New_Process_Name=”*bitsadmin.exe” Process_Command_Line IN (*create*,*addfile*,*addfileset*)
This search takes the list of 16 events down to 2, but it’s still in XML format. So let’s table out the fields of interest.
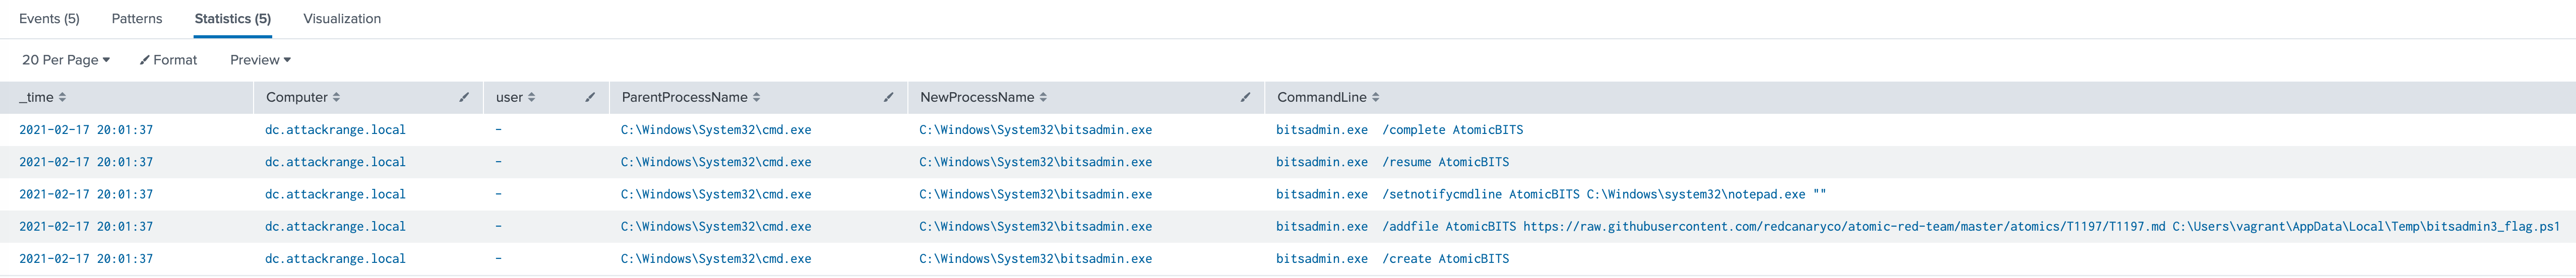
index=wineventlog EventCode=4688 New_Process_Name=”*bitsadmin.exe” Process_Command_Line IN (*create*,*addfile*,*addfileset*)
| table _time Computer src_user ParentProcessName NewProcessName CommandLine
It’s fairly clear from these results what happened on this endpoint. First, the BITS job was created as “AtomicBITS.” Secondly, a URL for a remote file was provided. Now that we’ve identified the hypothesis has taken place, the investigation can go further; let’s drill into the time of the event and look at what happened 5 minutes on either side of the identified actions.
Time of event before and after the identified actions
Now we have the chain of events associated with the BITS usage. The job was created, file was added, setnotifycmdline was used to execute the file with the named program (notepad.exe) once completed, and the job was started using the resume command. If this were an actual hunt, this would be the indicator and the start of a full investigation into what happened on this endpoint.
Findings May Require Further Investigation
While this is a streamlined example, the threat hunt approach is the same whether there are 10 or 10,000 endpoints. It all starts with the threat hunter stating what is being hunted, establishing the threat hunt hypothesis, and researching to ensure full understanding of the threat that is being hunted. Once a solid understanding is established, the search is developed and the threat hunt executed. Finally, any discovered events identified as a result of the threat hunt need to be investigated.
Stay tuned for the next article on this topic, where I’ll be covering Intelligence and IOC-based threat hunting techniques with Splunk.
Reference Links
- Splunk Attack Range – https://github.com/splunk/attack_range_local
- DetectionLab – https://detectionlab.network/
- MITRE T1197 – https://attack.mitre.org/techniques/T1197/
- Splunk .conf tstats talk – https://conf.splunk.com/files/2017/slides/searching-fast-how-to-start-using-tstats-and-other-acceleration-techniques.pdf
- LOLBAS (Living off the land binaries and scripts) – https://lolbas-project.github.io/lolbas/Binaries/Bitsadmin/
- Strontic Xcyclopedia – https://strontic.github.io/xcyclopedia/library/bitsadmin.exe-01AAB62D5799F75B0D69EB29C1CA6855.html
- Atomic Red Team – https://github.com/redcanaryco/atomic-red-team
- Deepwatch blog – https://www.deepwatch.com/blog/windows-event-4688/
- Microsoft’s bitsadmin.exe documentation – https://docs.microsoft.com/en-us/windows-server/administration/windows-commands/bitsadmin
- Splunk Documentation – https://docs.splunk.com/Documentation/Splunk/8.2.0/SearchReference/WhatsInThisManual
- Spunk .conf past sessions – https://conf.splunk.com/watch/conf-online.html#/
Share